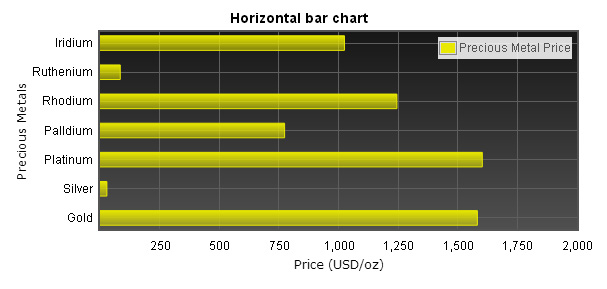
本章用貴金屬價格, 黃金、白金、白銀及鈀金的現價當作資料, 另外還會介紹如何控條圖的漸層色, 及控制圖表圖例的位置.
橫條圖範例(貴金屬價格)
橫條圖資料
一開始不免俗的一樣是放置定位點, 並且指定寬度和高度, 你可以直在用style設定, 或是指定一個CSS class給定位點.
        <style type="text/css">
        .mychart{
           width:300px;
           height:150px;
        }
        </style>
        <div id="flot-placeholder" class="mychart"></div>
        var rawData = [
            [1582.3, 0], //Gold
            [28.95, 1],  //Silver
            [1603, 2],   //Platinum
            [774, 3],    //Palladium
            [1245, 4],  //Rhodium
            [85, 5],      //Ruthenium
            [1025, 6]    //Iridium
        ];

        var dataSet = [
            { label: "Precious Metal Price", data: rawData, color: "#AB5800" }
        ];
        var ticks = [
            [0, "Gold"], [1, "Silver"], [2, "Platinum"], [3, "Palldium"], [4, "Rhodium"], [5, "Ruthenium"], [6, "Iridium"]
        ];
橫條圖選項
當你繪製橫條圖時, bars.horizontal必須設定為true, 若沒有設定, 就會變成直條圖. 在此範例裡我們設定了bars.fillColor, 這屬性可以接受的值可以是單一顏色(如rgba(255, 255, 255, 0.8))或是漸層色, 我們用的是後者. Flot裡指定漸層色的方法可以是
{ colors: [ color1, color2, ... ] }
{ colors: [ { opacity: 0.8 }, { opacity: 0.1 } ] }
        bars: {
            align: "center",
            barWidth: 0.5,
            horizontal: true,
            fillColor: { colors: [{ opacity: 0.5 }, { opacity: 1}] },
            lineWidth: 1
        }
在此我們為了美化刻度標籤的格式, 我們用了jQuery Number Formatter外掛, 讓x軸的值輸出成貨幣格式, 要改變刻度標籤可以複寫axis.tickFormatter, 此函式傳入了2個參數, tick value和axis object, 並且會傳回字串. 而Number Formatter可以到此下載.
而axis.axisLabel則是設定軸標籤, 此功能也是需要加入外掛程式jquery.flot.axislabels.js才能使用.
以下是軸選項的程式碼
        xaxis: {
            axisLabel: "Price (USD/oz)",
            axisLabelUseCanvas: true,
            axisLabelFontSizePixels: 12,
            axisLabelFontFamily: 'Verdana, Arial',
            axisLabelPadding: 10,
            max: 2000,
            tickColor: "#5E5E5E",
            tickFormatter: function (v, axis) {
                return $.formatNumber(v, { format: "#,###", locale: "us" });
            },
            color:"black"
        }

        yaxis: {
            axisLabel: "Precious Metals",
            axisLabelUseCanvas: true,
            axisLabelFontSizePixels: 12,
            axisLabelFontFamily: 'Verdana, Arial',
            axisLabelPadding: 3,
            tickColor: "#5E5E5E",
            ticks: ticks,
            color:"black"
        }
        legend: {
            noColumns: 0,
            labelBoxBorderColor: "#858585",
            position: "ne"
        }
呼叫$.plot完成繪圖
最後把上面建立的dataSet以及options帶入$.plot, 就完成了!
        $(document).ready(function () {
            $.plot($("#flot-placeholder"), dataSet, options);
            $("#flot-placeholder").UseTooltip();
        });
本範例完整程式碼
<!DOCTYPE html PUBLIC "-//W3C//DTD XHTML 1.0 Transitional//EN" "http://www.w3.org/TR/xhtml1/DTD/xhtml1-transitional.dtd">

<html xmlns="http://www.w3.org/1999/xhtml">
<head>
    <title></title>
    <script src="/js/lib/jquery-1.8.3.min.js" type='text/javascript'></script>
    <!--[if lte IE 8]><script language="javascript" type="text/javascript" src="/js/flot/excanvas.min.js"></script><![endif]-->

    <script type="text/javascript" src="/js/flot/jquery.flot.min.js"></script>
    <script type="text/javascript" src="/js/flot/jquery.flot.axislabels.js"></script>
    <script type="text/javascript" src="/js/flot/jshashtable-2.1.js"></script>
    <script type="text/javascript" src="/js/flot/jquery.numberformatter-1.2.3.min.js"></script>
    <script type="text/javascript">
        //******* Precious Metal Price - HORIZONTAL BAR CHART
        var rawData = [[1582.3, 0], [28.95, 1],[1603, 2],[774, 3],[1245, 4], [85, 5],[1025, 6]];
        var dataSet = [{ label: "Precious Metal Price", data: rawData, color: "#E8E800" }];
        var ticks = [[0, "Gold"], [1, "Silver"], [2, "Platinum"], [3, "Palldium"], [4, "Rhodium"], [5, "Ruthenium"], [6, "Iridium"]];

        var options = {
            series: {
                bars: {
                    show: true
                }
            },
            bars: {
                align: "center",
                barWidth: 0.5,
                horizontal: true,
                fillColor: { colors: [{ opacity: 0.5 }, { opacity: 1}] },
                lineWidth: 1
            },
            xaxis: {
                axisLabel: "Price (USD/oz)",
                axisLabelUseCanvas: true,
                axisLabelFontSizePixels: 12,
                axisLabelFontFamily: 'Verdana, Arial',
                axisLabelPadding: 10,
                max: 2000,
                tickColor: "#5E5E5E",
                tickFormatter: function (v, axis) {
                    return $.formatNumber(v, { format: "#,###", locale: "us" });
                },
                color: "black"
            },
            yaxis: {
                axisLabel: "Precious Metals",
                axisLabelUseCanvas: true,
                axisLabelFontSizePixels: 12,
                axisLabelFontFamily: 'Verdana, Arial',
                axisLabelPadding: 3,
                tickColor: "#5E5E5E",
                ticks: ticks,
                color: "black"
            },
            legend: {
                noColumns: 0,
                labelBoxBorderColor: "#858585",
                position: "ne"
            },
            grid: {
                hoverable: true,
                borderWidth: 2,
                backgroundColor: { colors: ["#171717", "#4F4F4F"] }
            }
        };

        $(document).ready(function () {
            $.plot($("#flot-placeholder"), dataSet, options);
            $("#flot-placeholder").UseTooltip();
        });

        var previousPoint = null, previousLabel = null;

        $.fn.UseTooltip = function () {
            $(this).bind("plothover", function (event, pos, item) {
                if (item) {
                    if ((previousLabel != item.series.label) ||
                 (previousPoint != item.dataIndex)) {
                        previousPoint = item.dataIndex;
                        previousLabel = item.series.label;
                        $("#tooltip").remove();

                        var x = item.datapoint[0];
                        var y = item.datapoint[1];

                        var color = item.series.color;
                        //alert(color)
                        //console.log(item.series.xaxis.ticks[x].label);

                        showTooltip(item.pageX,
                        item.pageY,
                        color,
                        "<strong>" + item.series.label + "</strong><br>" + item.series.yaxis.ticks[y].label +
                        " : <strong>" + $.formatNumber(x, { format: "#,###", locale: "us" }) + "</strong> USD/oz");
                    }
                } else {
                    $("#tooltip").remove();
                    previousPoint = null;
                }
            });
        };

        function showTooltip(x, y, color, contents) {
            $('<div id="tooltip">' + contents + '</div>').css({
                position: 'absolute',
                display: 'none',
                top: y - 10,
                left: x + 10,
                border: '2px solid ' + color,
                padding: '3px',
                'font-size': '9px',
                'border-radius': '5px',
                'background-color': '#fff',
                'font-family': 'Verdana, Arial, Helvetica, Tahoma, sans-serif',
                opacity: 0.9
            }).appendTo("body").fadeIn(200);
        }
    </script>
</head>
<body>
    <div style="width:450px;height:300px;text-align:center;margin:10px">
        <div id="flot-placeholder" style="width:100%;height:100%;"></div>
    </div>
</body>
</html>