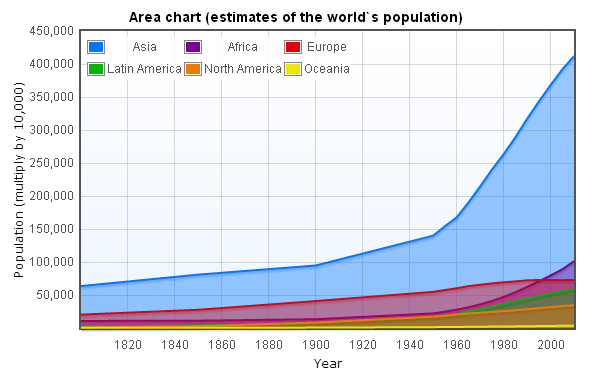
區域圖範例(歷年世界人口估計)
區域圖資料
我們先建立一個<div>, 並且指定一個id, 且設定長度及寬度, 這將會成為Flot繪圖的定位點.
<div id="flot-placeholder" style="width:400px;height:300px"></div>
        //Oceania
        var rawData1 = [
            [year(1800), 200], [year(1850), 200], [year(1900), 600], [year(1950), 1281], [year(1955), 1426],
            [year(1960), 1589], [year(1965), 1766], [year(1970), 1944], [year(1975), 2156], [year(1980), 2283],
            [year(1985), 2467], [year(1990), 2668], [year(1995), 2892], [year(2000), 3104], [year(2005), 3299],
            [year(2010), 3510]
        ];
        //North America
        var rawData2 = [
            //skip
        ];

        //rawData3 rawData4...

        function year(year) {
            return new Date(year, 1, 1).getTime();
        }
        var dataSet = [
            { label: "Asia", data: rawData6, color: "#0077FF" },
            { label: "Africa", data: rawData5, color: "#7D0096" },
            { label: "Europe", data: rawData4, color: "#DE000F" },
            { label: "Latin America", data: rawData3, color: "#00B503" },
            { label: "North America", data: rawData2, color: "#ED7B00" },
            { label: "Oceania", data: rawData1, color: "#E8E800" }
        ];
區域圖選項
區域圖和折線圖其實只差在series.lines.fill的設定, 若設定為true, 就會以區域圖繪製, 如果沒有設定或是設成false,就會以折線圖繪製. 而series.lines.show則是設定線條要不要顯示.
        series: {
            lines: {
                show: true,
                fill: true
            }
        }
另外為了控制x軸刻度標籤, 設定了xaxis.tickSize, tickSize為刻度之間的間隔大小,格式為[value, unit],我們設定為[20, "year"],表示年份會依每20年的間隔出現, 而unit也可以設定為"day"、"hour"等, 不過要特別注意, 如果你設定的unit太小如"hour"而你的資料來源且是以年計算的話,可能會因為Flot在繪圖時做得計算過久而造成瀏覽器無回應.
因為Flot沒有內建軸標籤的功能,所以需要加入jquery.flot.axislabels.js外掛程式來達成,加入後就可以設定,axis.axisLabel為要顯示的名稱axis.axisLabelPadding則設定標籤填充的空間大小,另外還可以設定字型及文字大小等.
為了讓刻度標籤更美觀, 可以用axis.tickFormatter自訂函式,這函式傳入了2個參數, tick value和axis object, 並且會傳回字串.要讓y軸的數字顯示貨幣格式,我們用了number formatter,如此一來y軸刻度標籤就能夠更易讀.
        xaxis: {
            axisLabel: "Year",
            axisLabelUseCanvas: true,
            axisLabelFontSizePixels: 12,
            axisLabelFontFamily: 'Verdana, Arial',
            axisLabelPadding: 10,
            mode: "time",
            tickSize: [20, "year"],
            timeformat: "%Y"
        }

        yaxis: {
            axisLabel: "Population (multiply by 10,000)",
            axisLabelUseCanvas: true,
            axisLabelFontSizePixels: 12,
            axisLabelFontFamily: 'Verdana, Arial',
            axisLabelPadding: 3,
            tickFormatter: function (v, axis) {
                return $.formatNumber(v, { format: "#,###", locale: "us" });
            }
        }
        legend: {
            noColumns: 3,
            labelBoxBorderColor: "#858585",
            position: "nw"
        }
另外因為我們會用到提示框功能,所以grid.hoverable要設定true,當hoverable為true時,Flot會監聽滑鼠事件並觸發"plothover"事件.
        grid: {
            hoverable: true,
            borderWidth: 2,
            backgroundColor: { colors: ["#ffffff", "#EDF5FF"] }
        }
提示框(tooltip)
由於Flot並沒有內建提示框功能,所以必須自行建置,以下是提示框功能完整程式碼,詳細的說明在往後的章節會提到.
        var previousPoint = null, previousLabel = null;

        $.fn.UseTooltip = function () {
            $(this).bind("plothover", function (event, pos, item) {
                if (item) {
                    if ((previousLabel != item.series.label) ||
                         (previousPoint != item.dataIndex)) {
                        previousPoint = item.dataIndex;
                        previousLabel = item.series.label;
                        $("#tooltip").remove();

                        var x = item.datapoint[0];
                        var y = item.datapoint[1];

                        var color = item.series.color;

                        showTooltip(item.pageX,
                                item.pageY,
                                color,
                                "<strong>" + item.series.label + "</strong><br>" + new Date(x).getFullYear() +
                                " : <strong>Population : " + $.formatNumber(y, { format: "#,###", locale: "us" }) + "</strong>  (multiply by 10,000)");
                    }
                } else {
                    $("#tooltip").remove();
                    previousPoint = null;
                }
            });
        };

        function showTooltip(x, y, color, contents) {
            $('<div id="tooltip">' + contents + '</div>').css({
                position: 'absolute',
                display: 'none',
                top: y - 10,
                left: x + 10,
                border: '2px solid ' + color,
                padding: '3px',
                'font-size': '9px',
                'border-radius': '5px',
                'background-color': '#fff',
                'font-family': 'Verdana, Arial, Helvetica, Tahoma, sans-serif',
                opacity: 0.9
            }).appendTo("body").fadeIn(200);
        }
完成繪圖
最後把上面建立的dataSet以及options帶入$.plot, 並把$.plot函式放到document.ready裡,防止dom還未完全載入Flot就開始繪圖所造成的錯誤.最後再用UseTooltip()建立提示框的功能.
        $(document).ready(function () {
            $.plot($("#flot-placeholder"), dataSet, options);
            $("#flot-placeholder").UseTooltip();
        });
timeformat參數
        %a: weekday name (customizable)
        %b: month name (customizable)
        %d: day of month, zero-padded (01-31)
        %e: day of month, space-padded ( 1-31)
        %H: hours, 24-hour time, zero-padded (00-23)
        %I: hours, 12-hour time, zero-padded (01-12)
        %m: month, zero-padded (01-12)
        %M: minutes, zero-padded (00-59)
        %q: quarter (1-4)
        %S: seconds, zero-padded (00-59)
        %y: year (two digits)
        %Y: year (four digits)
        %p: am/pm
        %P: AM/PM (uppercase version of %p)
        %w: weekday as number (0-6, 0 being Sunday)