Preparation
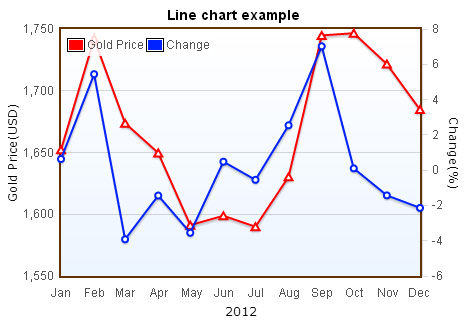
First, please make sure that you have downloaded the Flot file, if it`s not, you can go back to previous chapter to download. This is the first Flot chart you make, the most often used chart is line chart, so we use line chart as example. Line chart is often used for showing trends over time, temperature trend chart and stock chart are also often used.
Basic line chart
Starting to draw
Before you start to make charts, you have to specify a placeholder, this placehoder is where Flot will insert chart, you can put it in anywhere you want, between <body> tags.
<div id="flot-placeholder"></div>
    #flot-placeholder{
        width:350px;
        height:300px;
    }
    var data = [
        [1, 130], [2, 40], [3, 80], [4, 160], [5, 159], [6, 370],
        [7, 330], [8, 350], [9, 370], [10, 400], [11, 330], [12, 350]
    ];

    var dataset = [
        {
            label: "line1",
            data: data
        }
    ];
    var options = {
        series: {
            lines: { show: true },
            points: {
                radius: 3,
                show: true
            }
        }
    };
    $(document).ready(function () {
        $.plot($("#flot-placeholder"), dataset, options);
    });
$.plot(placeholder, data, options))
1. placeholder : a DOM element, Flot will insert chart into this element, this element must be specified with width and height.
2. data : a data array, as we mentioned above.
3. options : you can specify values to attributes in the options, or change the appearance of charts、choose what kind of charts to make.
Below is all of codes of basic line chart.
    <!DOCTYPE html PUBLIC "-//W3C//DTD XHTML 1.0 Transitional//EN" "http://www.w3.org/TR/xhtml1/DTD/xhtml1-transitional.dtd">
    <html xmlns="http://www.w3.org/1999/xhtml">
    <head>
         <style type="text/css">
            #flot-placeholder{width:350px;height:300px;}
        </style>
        <!--[if lte IE 8]><script language="javascript" type="text/javascript" src="http://www.pureexample.com/js/flot/excanvas.min.js"></script><![endif]-->
        <script type="text/javascript" src="http://www.pureexample.com/js/lib/jquery-1.8.3.min.js"></script>
        <script type="text/javascript" src="http://www.pureexample.com/js/flot/jquery.flot.min.js"></script>
        <script type="text/javascript">
            var data = [[1, 130], [2, 40], [3, 80], [4, 160], [5, 159], [6, 370], [7, 330], [8, 350], [9, 370], [10, 400], [11, 330], [12, 350]];

            var dataset = [{label: "line1",data: data}];

            var options = {
                series: {
                    lines: { show: true },
                    points: {
                        radius: 3,
                        show: true
                    }
                }
            };

            $(document).ready(function () {
                $.plot($("#flot-placeholder"), dataset, options);
            });
        </script>
    </head>
    <body>
        <div id="flot-placeholder"></div>
    </body>
    </html>