Flot data format

We`ve learned about how to make a basic line chart in the last chapter, so in this chapter we will talk about the most important part - data format, beofre you make any charts it`s important to make data in the right format that Flot needs, if the data is incorrect or not in the right format, the charts will not come out right. This chapter is all about the data parameter for calling $.plot.

Basic data format


Flot data format is consist of multiple data seires array, like the following format.
        [series1, series2, series3, ...]
        
And each data series is consist of values of x axis and y axis.
        [x, y]
        
Put it all together, Flot data will be the following format.
            var data = [
                [x1, y1], [x2, y2], [x3, y3], [x4, y4]
            ];
        
Below are the correct data formats
        var data_integer = [
            [0, 5], [1, 10], [2, 15], [3, 20]
        ];
        var data_float = [
            [1, 5.5], [2.5, -10], [4.5, 15], [6, -20.3]
        ];
        var data_null = [
            [1, 5.5], [2.5, null], [4.5, 15], [6, null]
        ];
        
In addition, the values of x axis and y axis must be number format(integer or float), no string format allowed, even if you`re using time series format data, you have to convert into javascript timestamps, that is, milliseconds since 1/1/1970 00:00:00 UTC. You can also use null value in Flot, if value of a data point is set to nulll, that particular data point will be ignored when drawing.

Below shows how to take parameters into function when calling $.plot (label attribute can be omitted, but data attribute must be specified)
        $.plot(placeholder,[
                {
                    label: "line1", 
                    data: [
                        [0, 5], [1, 10], [2, 15], [3, 20]
                    ]
                }
            ], 
            options);
        
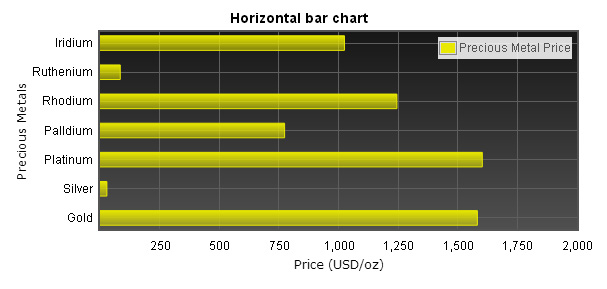
Bar chart with null value

Time series data format

If you`re using time series format as data, In addition to convert time into javascript timestamps format, you also need to set axis.mode value to "time" in the options, and include jquery.flot.time.js plugin, below shows you how to use time series.
        var rawData = [
            [1325347200000, 60], [1328025600000, 100], [1330531200000, 15], [1333209600000, 50]
        ];

        var options = {
            xaxis: {
                mode: "time"
            }
        }

        $.plot($("#placeholder"),[
                {                    
                    data: rawData
                }
            ], 
            options);
        
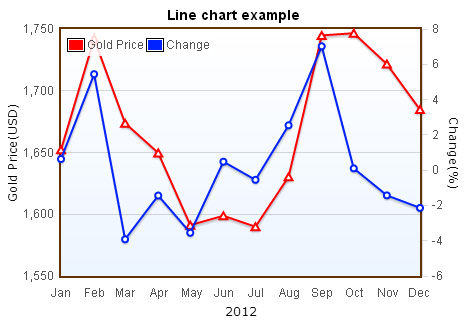
Time series line chart

Multiple data series format

Data formats we mentioned above are all have single data seires, but there are times that we need to use multiple data series, the following code shows you how to do it.
        var rawData_1 = [
            [1325347200000, 60], [1328025600000, 100], [1330531200000, 15], [1333209600000, 50]
        ];

        var rawData_2 = [
            [1325347200000, 5], [1328025600000, 12], [1330531200000, 7], [1333209600000, 25]
        ];

        var dataset = [
            { 
                label: "Sales", 
                data: rawData_1 
            },
            { 
                label: "Profits", 
                data: rawData_2
            }
        ];

        $.plot($("#placeholder"), dataset, options);
        
add more data series subsequently if needed
        var dataset = [
            { series1 },
            { series2 },
            { series3 },
            ....
        ];
        
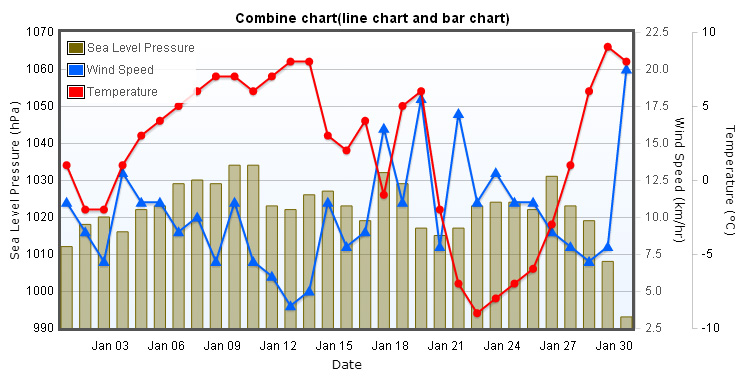
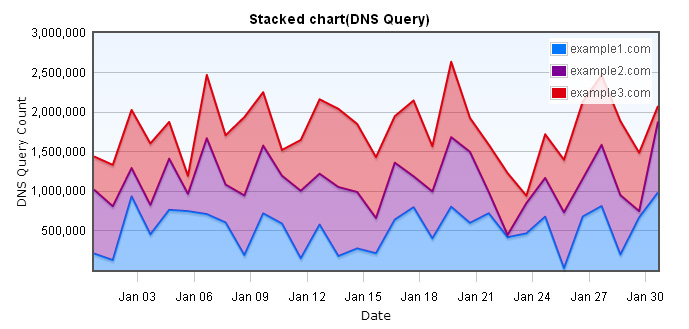
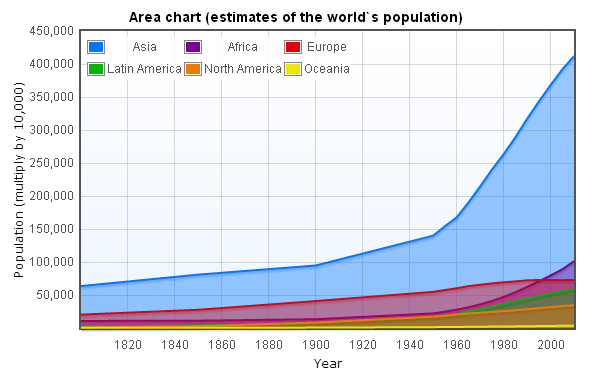
Mutiple data series chart