When you finish making a chart, I believe that you will want to make the chart
looks more nicely by changing the color and width of lines or changing the size
and appearance of data points, this chapter will show you how to archive this.
Fill color and data series color
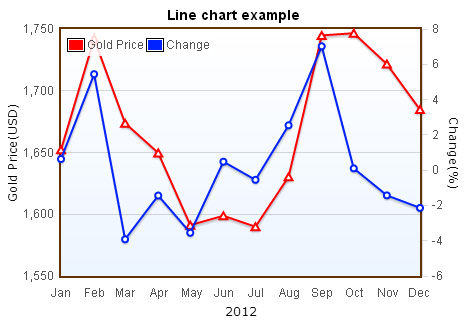
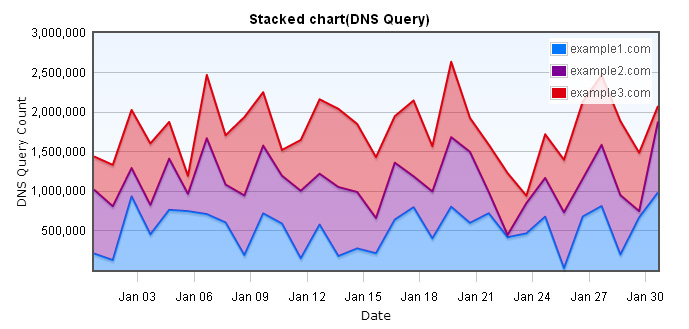
Flot provides a lot of options for you to use, we take fill color for example,
The chart below shows how a chart with filled color looks like.
Below shows the codes of the chart above, when using fillColor attribute, fill
attribute also have to set to ture to take effect.
            var options = {
                series: {
                    lines: {
                        show: true,
                        fill: true,
                        fillColor: { colors: [{ opacity: 0.7 }, { opacity: 0.1}] }
                    },
                    points:{
                        show: true,
                        radius: 3
                    }
                },
                colors: ["#FF7070", "#0022FF"],
            };

            $.plot(placeholder, data, options);
fillColor attribute can be set with a single color or a gradient color,in here,
we use a gradient color, there are two ways for making a gradient color, the
first one is to specify two colors with the code format below.
        fillColor: {
            colors: ["#000", "#fff"]
        }
the other one is to specify opacity
        fillColor: {
            colors: [{ opacity: 0.7 }, { opacity: 0.1}]
        }
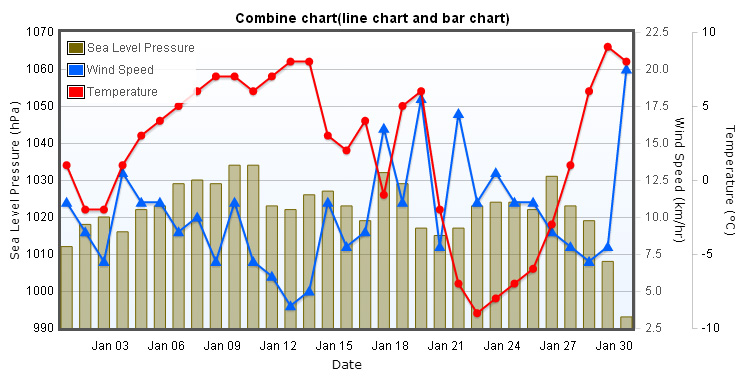
Data series attributes
The code below shows a complete data seires attributes, you can try each one of
them to create different appearance of charts.
series: {
//line chart、point chart and bar chart
lines, points, bars: {
//set to true to make charts show
show: boolean
//width of lines
lineWidth: number
//set true to fill the shape
fill: boolean or number
//the color of the fill
fillColor: null or color/gradient
//this is only used by line chart
steps: boolean
}
//data points
points: {
//the radius of data points
radius: number
//the shape of data points, default is circle
//there are other shapes available like square、diamond、triangle、cross
//but you need to include jquery.flot.symbol.js plug-in to take effect
symbol: "circle" or function
}
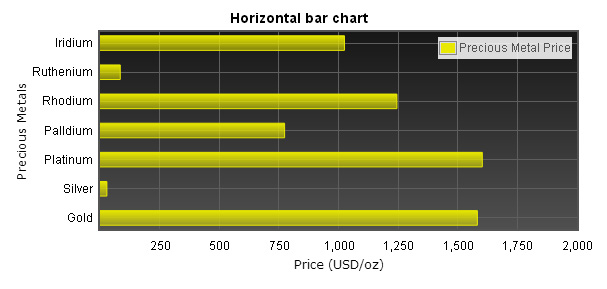
//bar chart
bars: {
//width of bar
barWidth: number
//specifies how a bar should aligned
align: "left", "right" or "center"
//will show as horizontal bar chart if set to true
horizontal: boolean
}
//shadow size of charts
shadowSize: number
}
//colors of data series, series1 is correspond to color1, series2 is correspond to color2, and so on
colors: [ color1, color2, ... ]