This chapter shows you how to make a vertical bar chart and horizontal bar chart. Making a bar chart is not so different from making a line chart, if you have read the last chapter line chart, you can get started easily in this chapter.
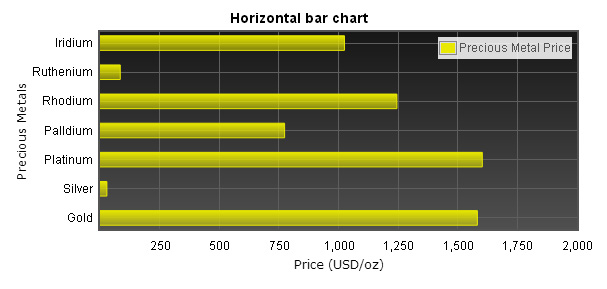
Bar chart example
Making a bar chart
In this example, we use average temperature of world cities in 2012 as data source, to make this example simplier, we only take six cities data.First, insert the palceholder into the page, and specify it`s id as well as the length and width.
<div id="flot-placeholder" style="width:400px;height:300px"></div>
        var data = [
            [0, 11], //London, UK
            [1, 15], //New York, USA
            [2, 25], //New Delhi, India
            [3, 24], //Taipei, Taiwan
            [4, 13], //Beijing, China
            [5, 18]  //Sydney, AU
        ];

        var dataset = [
            { label: "2012 Average Temperature", data: data, color: "#5482FF" }
        ];
After finished with ticks array, we can assign ticks to xaxis.ticks, this way, tick labels of x axis will show the name of cities. You can also create your own tick labels for y axis by setting value to yaxis.ticks.
        var ticks = [
            [0, "London"], [1, "New York"], [2, "New Delhi"], [3, "Taipei"], [4, "Beijing"], [5, "Sydney"]
        ];

        xaxis: {
          ticks: ticks
        }
             series: {
                bars: {
                    show: true
                }
            },
            bars: {
                align: "center",
                barWidth: 0.5
            }
        yaxis: {
            tickFormatter: function (v, axis) {
                return v + "°C";
            }
        }
        xaxis: {
            axisLabel: "World Cities",
            axisLabelUseCanvas: true,
            axisLabelFontSizePixels: 12,
            axisLabelFontFamily: 'Verdana, Arial',
            axisLabelPadding: 10
        }

        yaxis: {
            axisLabel: "Average Temperature",
            axisLabelUseCanvas: true,
            axisLabelFontSizePixels: 12,
            axisLabelFontFamily: 'Verdana, Arial',
            axisLabelPadding: 3
        }
        $(document).ready(function () {
            $.plot($("#flot-placeholder"), dataset, options);
        });
Complete code of this chapter
<!DOCTYPE html PUBLIC "-//W3C//DTD XHTML 1.0 Transitional//EN" "http://www.w3.org/TR/xhtml1/DTD/xhtml1-transitional.dtd">

<html xmlns="http://www.w3.org/1999/xhtml">
<head>
    <title></title>
    <script src="/js/lib/jquery-1.8.3.min.js" type='text/javascript'></script>
    <!--[if lte IE 8]><script language="javascript" type="text/javascript" src="/js/flot/excanvas.min.js"></script><![endif]-->

    <script type="text/javascript" src="/js/flot/jquery.flot.min.js"></script>
    <script type="text/javascript" src="/js/flot/jquery.flot.symbol.js"></script>
    <script type="text/javascript" src="/js/flot/jquery.flot.axislabels.js"></script>

    <script type="text/javascript">
        //******* 2012 Average Temperature - BAR CHART
        var data = [[0, 11],[1, 15],[2, 25],[3, 24],[4, 13],[5, 18]];
        var dataset = [{ label: "2012 Average Temperature", data: data, color: "#5482FF" }];
        var ticks = [[0, "London"], [1, "New York"], [2, "New Delhi"], [3, "Taipei"],[4, "Beijing"], [5, "Sydney"]];

        var options = {
            series: {
                bars: {
                    show: true
                }
            },
            bars: {
                align: "center",
                barWidth: 0.5
            },
            xaxis: {
                axisLabel: "World Cities",
                axisLabelUseCanvas: true,
                axisLabelFontSizePixels: 12,
                axisLabelFontFamily: 'Verdana, Arial',
                axisLabelPadding: 10,
                ticks: ticks
            },
            yaxis: {
                axisLabel: "Average Temperature",
                axisLabelUseCanvas: true,
                axisLabelFontSizePixels: 12,
                axisLabelFontFamily: 'Verdana, Arial',
                axisLabelPadding: 3,
                tickFormatter: function (v, axis) {
                    return v + "°C";
                }
            },
            legend: {
                noColumns: 0,
                labelBoxBorderColor: "#000000",
                position: "nw"
            },
            grid: {
                hoverable: true,
                borderWidth: 2,
                backgroundColor: { colors: ["#ffffff", "#EDF5FF"] }
            }
        };

        $(document).ready(function () {
            $.plot($("#flot-placeholder"), dataset, options);
            $("#flot-placeholder").UseTooltip();
        });

        function gd(year, month, day) {
            return new Date(year, month, day).getTime();
        }

        var previousPoint = null, previousLabel = null;

        $.fn.UseTooltip = function () {
            $(this).bind("plothover", function (event, pos, item) {
                if (item) {
                    if ((previousLabel != item.series.label) || (previousPoint != item.dataIndex)) {
                        previousPoint = item.dataIndex;
                        previousLabel = item.series.label;
                        $("#tooltip").remove();

                        var x = item.datapoint[0];
                        var y = item.datapoint[1];

                        var color = item.series.color;

                        //console.log(item.series.xaxis.ticks[x].label);

                        showTooltip(item.pageX,
                        item.pageY,
                        color,
                        "<strong>" + item.series.label + "</strong><br>" + item.series.xaxis.ticks[x].label + " : <strong>" + y + "</strong> °C");
                    }
                } else {
                    $("#tooltip").remove();
                    previousPoint = null;
                }
            });
        };

        function showTooltip(x, y, color, contents) {
            $('<div id="tooltip">' + contents + '</div>').css({
                position: 'absolute',
                display: 'none',
                top: y - 40,
                left: x - 120,
                border: '2px solid ' + color,
                padding: '3px',
                'font-size': '9px',
                'border-radius': '5px',
                'background-color': '#fff',
                'font-family': 'Verdana, Arial, Helvetica, Tahoma, sans-serif',
                opacity: 0.9
            }).appendTo("body").fadeIn(200);
        }
    </script>
</head>
<body>
    <div style="width:450px;height:300px;text-align:center;margin:10px">
        <div id="flot-placeholder" style="width:100%;height:100%;"></div>
    </div>
</body>
</html>