Flot is easy to use, just a few lines of code, you can make a simple line chart, it also provides a comprehensive API documentation where you can find examples, usage and methods. The most important, Flot continues to release new versions, each new version comes with new features. We will introduce you more features of Flot in the following chapters.
Average temperature of cities
Flot is a javascript plotting library, it`s small, performance is good and supports all kinds of chart types. There are also plugins for Flot to use.
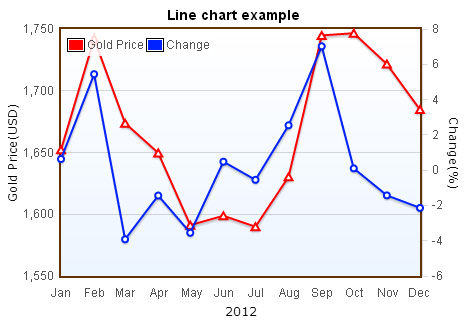
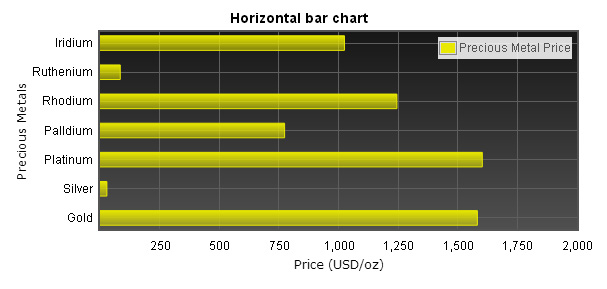
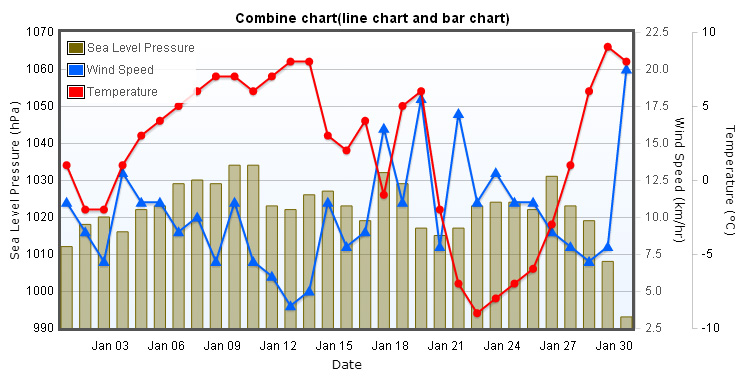
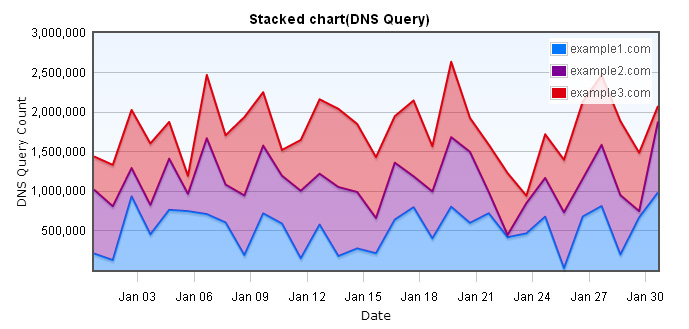
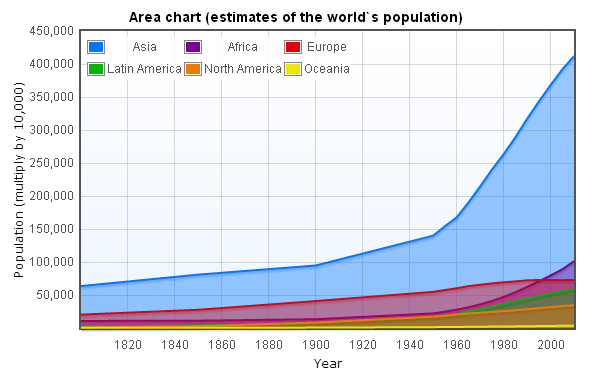
There are many chart types available like Line chart、Pie chart、Bar chart、Area chart、Stacked chart, Flot also supports real time update chart and Ajax update chart, if you know little about javascript and jQuery, you could get started with Flot easily.
Performance
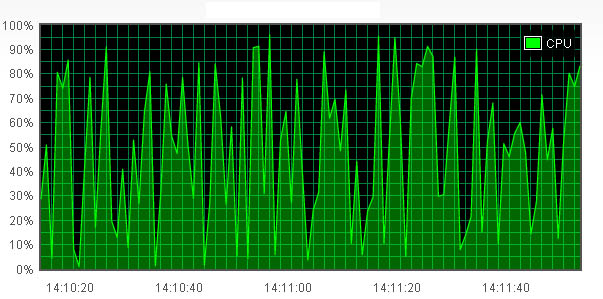
Flot can handle hundreds of data points easily, even if you`re using real time update chart, to redraw the chart in every 100 milliseconds, still runs very fast. Flot can be run on IE、Firefox、Chrome、Safar and Opera. Because Flot uses HTML5 Canvas, if you`re using IE8 and below, you can use excanvas to make IE simulates HTML5 Canvas, this way makes Flot can work properly on IE.How to use
You can download Flot from here .Then including the required files below in the <header>.
    <!--[if lte IE 8]><script language="javascript" type="text/javascript" src="excanvas.js"></script><![endif]-->
    <script type="text/javascript" src="jquery.js"></script>
    <script type="text/javascript" src="jquery.flot.js"></script>
Next, insert a <div> into <body> and specify an id to it, this is where the chart will be inserted, also you need to specify width and height.
<div id="flot-placeholder" style="width:300px;height:150px"></div>
    <script type="text/javascript">
        $(document).ready(function () {
            $.plot($("#flot-placeholder"),
                   data,
                   options);
        });
    </script>